What song is next?
Do you ever create plyalist on YouTube, Deezer or Spotify? What criteria do you use to put your music in order? Do you like to switch between tunes with fast and slow tempi? What about tonality, time-signature, and instrumentation? Do you think about any of these asepcts when planning out the songs for a workout session, for a roadtrip, or for a party?
I guess most people don’t worry about that. Random shuffles and automatic playlists seem to be good enought for the wide audicenes. Musicians and producers, however, have to deal with this problem all the time. When creating their playlists - also known as albums -, professional artists are trying to maximize the enjoyability of their work. It is in their best interest to provide a succession of songs which is interesting to most listeners.
Throughout my life, I’ve listened to quite a few of these professionally made playlists, and I couldn’t help but notice that there are some patterns in the way that tunes are put together. Generally, contrast is a top priority. Tracks within an album usually alternate between sad and happy, fast and slow, major and minor, etc…
In this study I am trying to answer the following questions:
- Is there a real tendency for contrast between successive songs within a professional album?
- Are there any patterns governing the order of tracks within an album? If so, are these patterns consistent across different musical genres?
- Can we predict what song comes next just by looking at its acoustic features?
- If there is a pattern pattern, does it match with the playlists that are created by the general audience?
- Can we improve the enjoyability of a song by controllig what comes before and after it?
Spotify and database
Using Spotify’s web API, we have access to an extremely rich data base, which allows us to access numrous albums from different artists, years, genres and countries. Spotify’s database also provides us with an interesting - to say the least - analysis feature, which describes any song in terms of its tonality, rythm, tempo, valence, energy, and danceability. The access to this database is not entirely intuitive, and you might need some coding skills in order to put your hands on it. Luckily, however, you can access my codes here.
The first sample consisted of 9 different musical genres. From each genre, I sampled 5 random artists. From each one of these artists, I took up 10 random albums - according to the number of albums the artist has -, with all of its tracks with analytics included. Final sample comprised 45 artists, 79 albums and 1604 tracks. You can access this data here.
First analysis
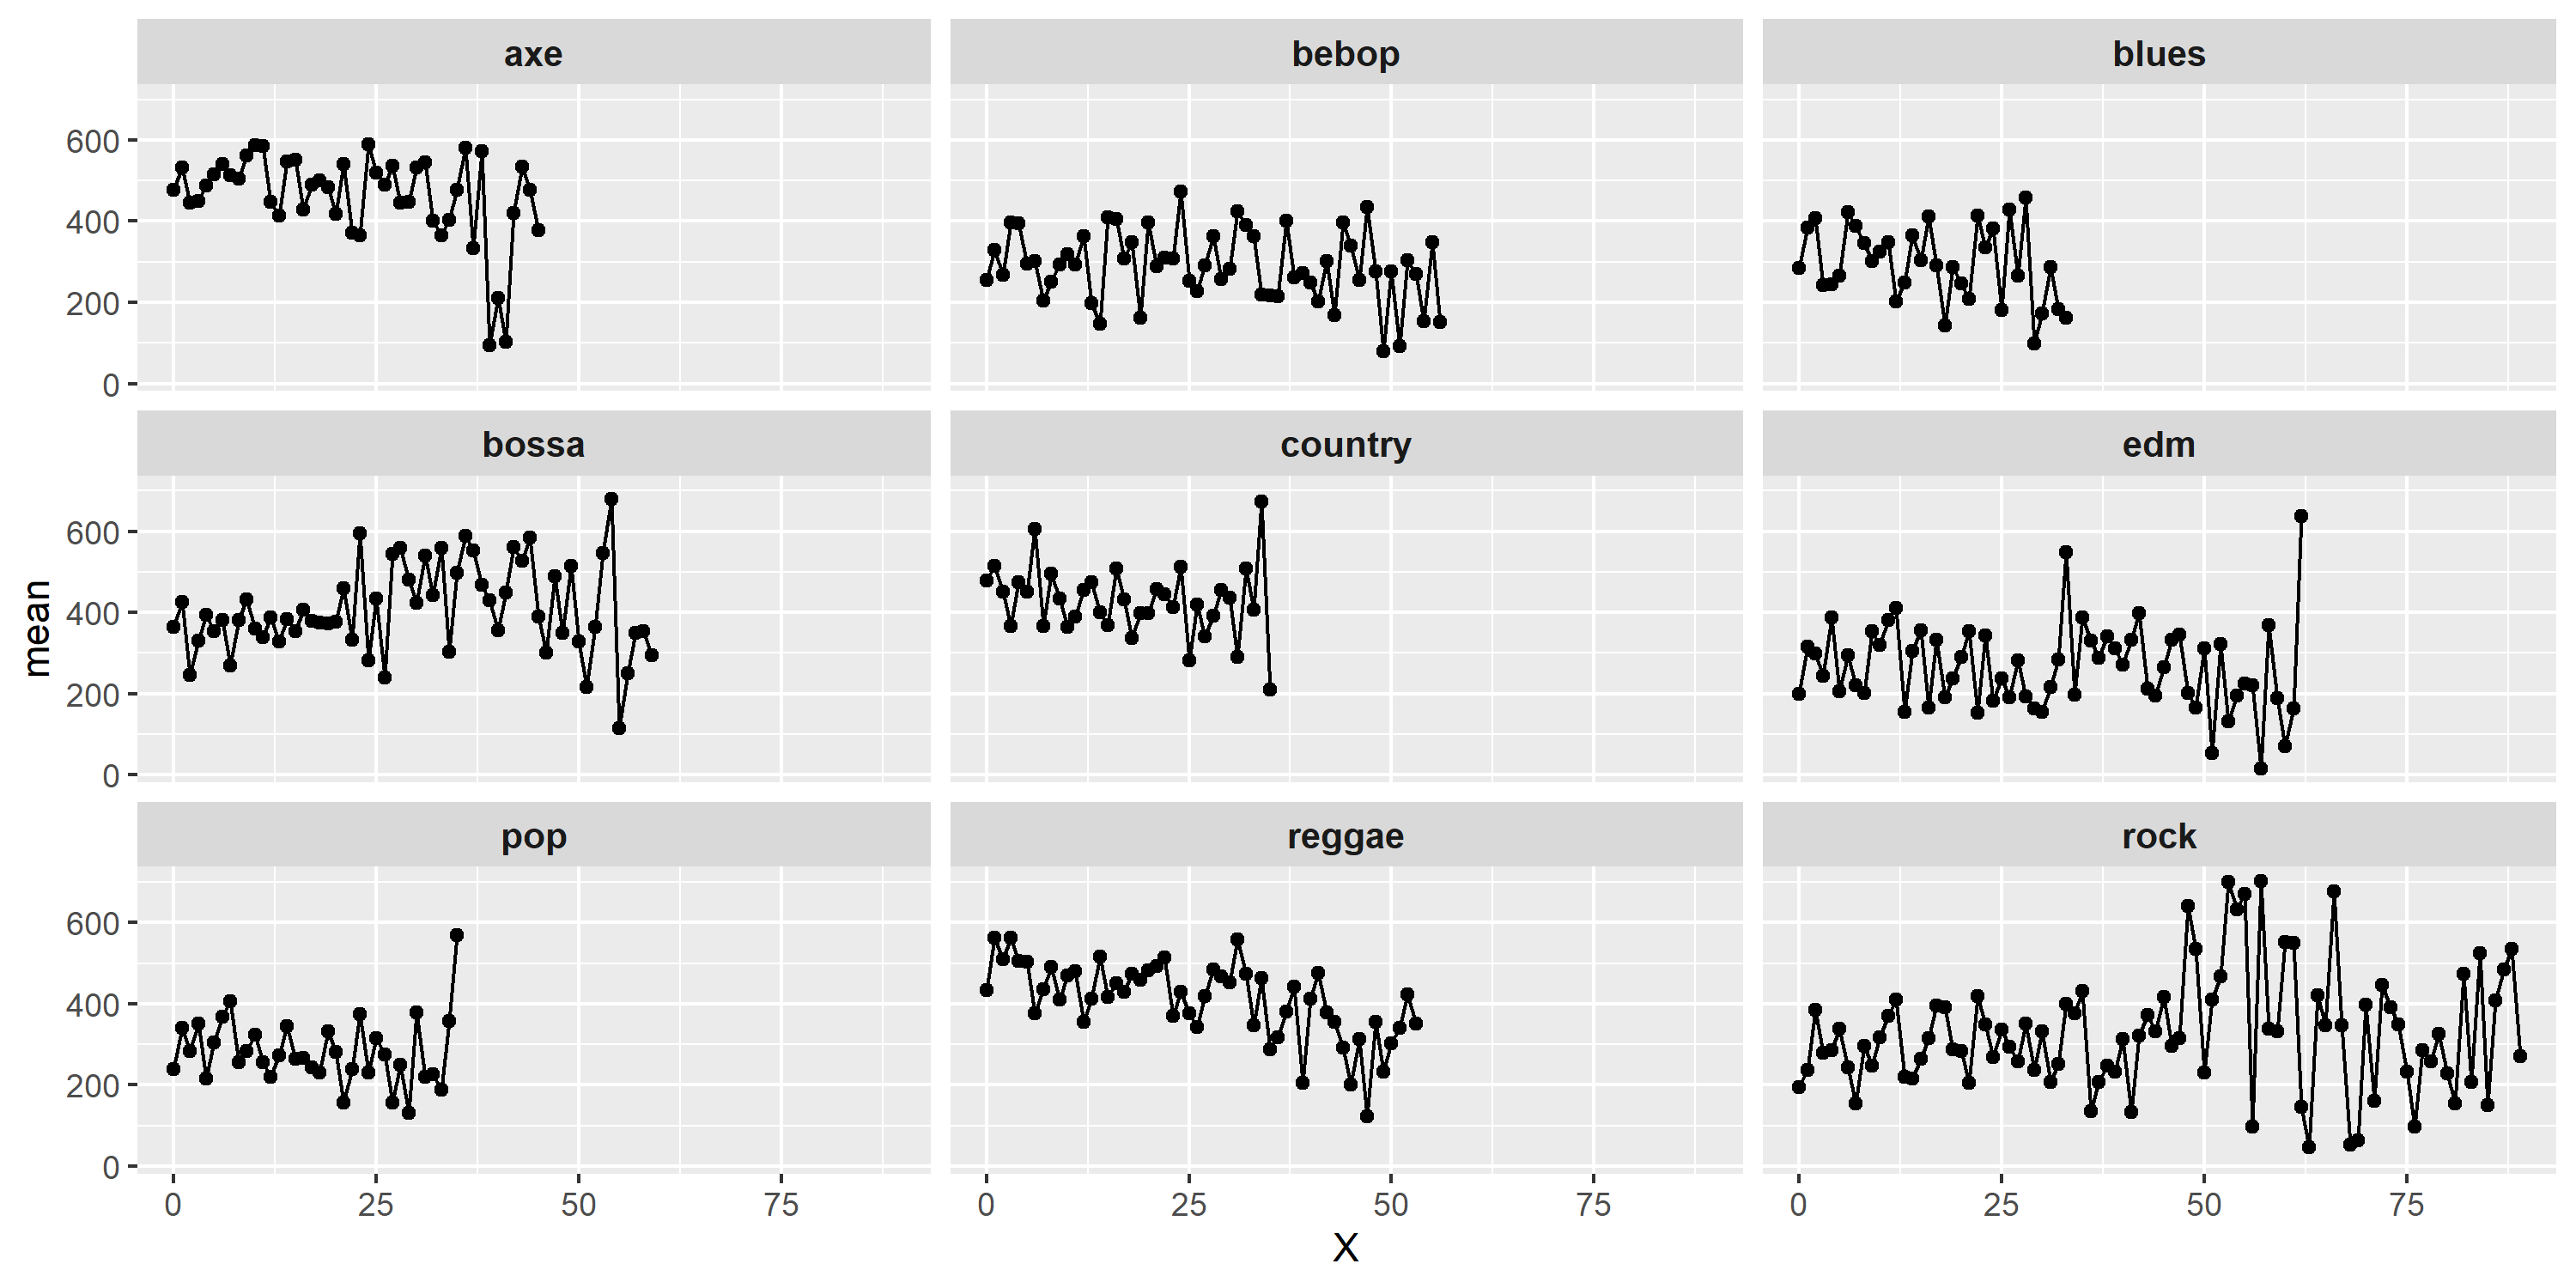
My first analysis consisted of the valence of tracks throughout the album. According to spotify, high valence tracks “sound more positive (e.g. happy, cheerful, euphoric), while tracks with low valence sound more negative (e.g. sad, depressed, angry).”. In the graph below we see valence (y axis) plotted against track number (x axis). It seems like songs do alternate between sad and happy, after all, we see a pattern of ups and downs throughout the x axis. Code for the graphs can be found here.

Seeing is not enough, and right now I am working on a statistical model to describe the behavior of valences throughout album tracks. My basic idea is to compare a linear model with a periodic one. If, in fact, the periodic model minimizes error in comparison with the linear one, we would have additional evidence in favor of my hypothesis.
###I’ll update this post as soon as I have more data###