Music order - Update
Here I am attempting to create a descriptive model representing the way that tracks are ordered throughout an album. My assumption is that there is some sort of pattern in loudness, tempo, energy and valence of tracks throughout an album, and that this can tell us something about how to sort out tracks in our own playlists.
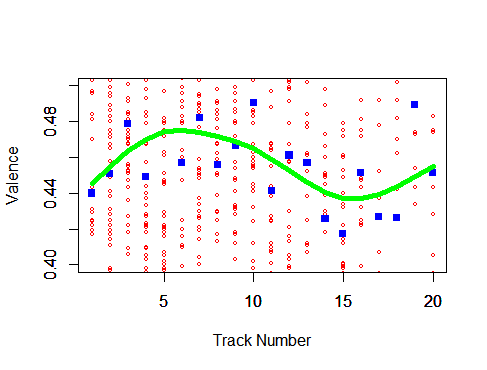
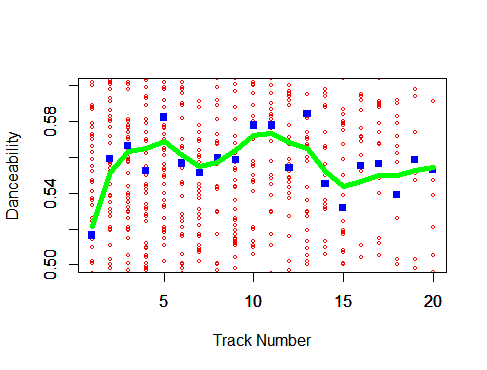
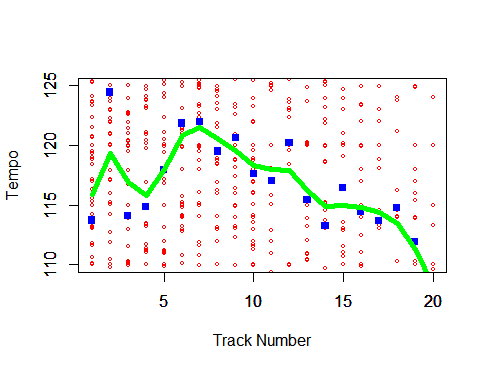
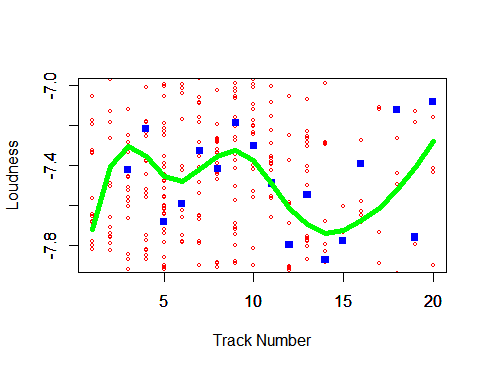
In order to do that, I created 5 spline models, which attempt to describe the behavior of data in a non-linear manner. Here is how you read the plots below:
- The x axis represents tracks within an album;
- The y axis represents the magnitude of a certain feature (i.e. how loud, fast or energetic a track is);
- Red dots represents single tracks of each album;
- Blue dots represent mean values for the feature across all the albums in our database;
- Green lines represents our fitted model, which attempts to describe how each feature behaves throughout an album
##Building the Models

##Valence
modelo1 <- smooth.spline(oi$track_number, oi$valence, df=5)
#Energy
modelo2 <- smooth.spline(oi$track_number, oi$energy, df=5)
#Tempo
modelo3 <- smooth.spline(oi$track_number, oi$tempo, df=10)
#Danceability
modelo4 <- smooth.spline(oi$track_number, oi$danceability, df=10)
#Loudness
modelo5 <- smooth.spline(oi$track_number, oi$loudness, df=7)
##Plotting


